

Event Report: Building an APM with OpenTelemetry and OpenSource

On 3rd May, we hosted Goutham - Prometheus Maintainer and Product Manager from Grafana Labs on our Discord community - Last9 of Reliability. He presented a talk on "Building an APM with OpenTelemetry and OpenSource". This post summarizes the event.
I had met Goutham at SRECon Americas in March where he had given this talk, and I thought this will be relevant for our Discord community where we discsuss about Promtheus, OpenTelemetry, Observability and Monitoring. Thanks a lot Goutham for taking time and giving this talk.
Importance of OpenTelemetry
Goutham started with explaining what OpenTelemetry is and how it is neutralizing the landscape of Observability tooling by providing standards, specifications and conventions around how the Telemetry data should be collected. OpenTelemetry also provides client side libraries and SDKs for auto-instrumentation which helps getting started with instrumentation with OpenTelmetry much easier without much effort from developers.
OpenTelemetry Architecture

Goutham then gave a brief overview of OpenTelemetry Architecture with going over details of OpenTelemetry Collector.
Collector is a vendor agnostic way to receive, process and export telemetry data and allows switching Observability backends seamlessly without changing anything in the instrumentation layer.

This is the best document about knowing more on OpenTelemetry Architecture https://opentelemetry.io/docs/reference/specification/overview/
Popularity of OpenTelemetry
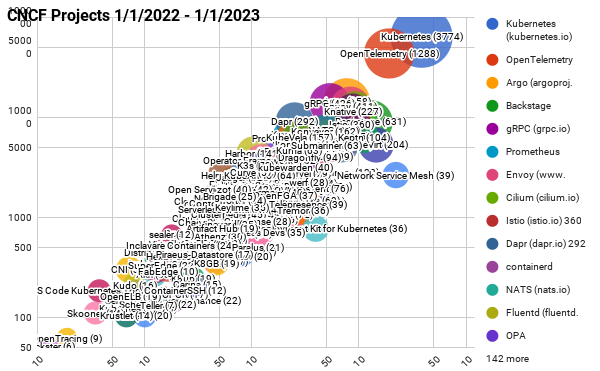
After that Goutham talked about the growing popularity of OpenTelemetry. While there are lot of open source projects and sometimes investing into which can be a hard decision, in case of OpenTelemetry, the adoption is only increasing from contributors, users and even vendors. The Github issues and pull requests on the OpenTelemetry project in last one year is only second to Kubernetes.
Coming back to APM
After explaining OpenTelemetry and its importance in detail, we moved to the APM part. Goutham's definition of APM is simple.
Easy to instrument.
Probably an agent.
High Quality telemetry and dashboards.
Demo time
After that, we saw a Demo in action where Goutham used a variation of https://github.com/open-telemetry/opentelemetry-demo to demonstrate how Metrics, Logs, and Traces from different services of a sample eCommerce application can be seen together. The Demo went into great detail explaining how to visualize the data as well co-relating different telemetry with each other.
Caveats
While OpenTelemetry has lot of promise, Goutham shared few caveats.
Metrics are not fully stabilized. He used traces to generate metrics in the demo.
Semantic conventions are getting stabilized.
Logging is pretty early.
But even with these limitations, the pace at which things are moving is pretty fast and gives enough confidence to invest in OpenTelemetry.
The Bonus Demo: SRE Standardization
Goutham demoed how they onboard new services using RED dashboards and how they automate SLOs by following OpenTelemetry Semantic conventions, that was the most cool part of the demo!
The session was quiet interactive with people asking questions around following topics.
Does auto instrumentation need changes on the App side ?
- Mostly no, auto-instrumentation as word says provides auto instrumentation out of the box. Here are more details.
Does auto instrumentation supports different databases? For example :- If I am using auto instrumentation on Python which uses MySQL as a backend. Am I able to get MySQL query insights ?
- Yes, it is possible.
What is the performance overhead for adding metrics/traces in an application?
- Should not be much unless you are in extremely hot code path in which case, you should not add instrumentation in such code paths.
What’s the infra requirement to run the collector?
- This was an interesting question but there was not a definite answer to it.
Does collector pull the metrics or its application duty to push it to collector?
- Application pushes it.
Are agents pluggable? Can i develop a drop in replacement for agents?
- Probably it can work for metrics if the drop in replacement exposes metrics on
/metricsand collectors scrapes it.
- Probably it can work for metrics if the drop in replacement exposes metrics on
Are incumbents like NewRelic or DataDog adopting OpenTelemetry?
- Yes :). There is a big push from all almost all big vendors.
How to get involved in the otel community?
- CNCF Slack can be a good place to start with.
Here are the slides from Goutham.
Unfortunately, we couldn't record the talk, but here is recording of Goutham's talk from SRECon on the same topic.
I also tried to summarize the talk in a tweet thread:
We will be hosting more such events on our Community Discord. Join today to not miss out on them.
Related Articles
What is OpenTelemetry Collector
Instrumenting Java applications using OpenTelemetry
Instrumenting Golang applications using OpenTelemetry
Read more about the difference between Prometheus vs. OpenTelemetry.
Here is a post on How to filter metrics by labels using OpenTelemetry Collector.


